Posts: 456
Threads: 63
Joined: Apr 2022
Reputation:
10
09-24-2022, 11:56 PM
(This post was last modified: 09-25-2022, 12:01 AM by PhilOfPerth.)
Somewhere in the system, there’s a Debug that used to be available for finding and fixing coding errors, but it seems to be no
longer usable or available.
I would like to see one re-produced that could be used by pleb- coders (like me) easily and effectively, to help find some of
those elusive bugs we all encounter. I’m not capable of this kind of project, but here are the “bare bones” for an algorithm that
I believe would be close to what we need:
1. The declarant that starts the debug feature, _Debug which is placed before executable code.
2. Coders place a breakpoint, maybe * or BP, at any points they wish to see the state of their variables.
3. When run, when the program reaches a BP, it pauses execution, and switches to another screen that displays (only) the
variables that have changed since the last BP, with their new state.
4. Pressing a key clears the new screen, returns the original screen and resumes the programme.
5. A closing key is needed for when coding is complete, that removes all BPs and the Debug declarant.
Whatever is produced, it needs to be simple to use, flexible, and easily accesssed.
This may seem like re-inventing the wheel, but some of our wheels are a bit flat-bottomed or even triangular at the moment!
 Any takers?
Of all the places on Earth, and all the planets in the Universe, I'd rather live here (Perth, W.A.) 
Posts: 241
Threads: 10
Joined: Apr 2022
Reputation:
30
(09-24-2022, 11:56 PM)PhilOfPerth Wrote: Somewhere in the system, there’s a Debug that used to be available for finding and fixing coding errors, but it seems to be no
longer usable or available.
I would like to see one re-produced that could be used by pleb- coders (like me) easily and effectively, to help find some of
those elusive bugs we all encounter. I’m not capable of this kind of project, but here are the “bare bones” for an algorithm that
I believe would be close to what we need:
1. The declarant that starts the debug feature, _Debug which is placed before executable code.
2. Coders place a breakpoint, maybe * or BP, at any points they wish to see the state of their variables.
3. When run, when the program reaches a BP, it pauses execution, and switches to another screen that displays (only) the
variables that have changed since the last BP, with their new state.
4. Pressing a key clears the new screen, returns the original screen and resumes the programme.
5. A closing key is needed for when coding is complete, that removes all BPs and the Debug declarant.
Whatever is produced, it needs to be simple to use, flexible, and easily accesssed.
This may seem like re-inventing the wheel, but some of our wheels are a bit flat-bottomed or even triangular at the moment!
 Any takers? Any takers?
I told you the debug feature is still there and working, but if people are to lazy to use the wiki and spend some time to learning by doing, then this is not the fault of QB64.
Posts: 456
Threads: 63
Joined: Apr 2022
Reputation:
10
@RhoSigma: Laziness had nothing to do with it! I spent a lot of time trying to find the Debug operating details, without success, so I hoped someone with a bit more familiarity with the system would provide them, or at least a path to them.
Oh well!
I have found them now (I found the Wiki itself hard to locate) but am still at a loss as to how to examine my variables states.
I see that I can step through the programme, one line at a time, but nothing in the Wiki instructions tells me how to see the values or changes in variables.
I guess I'll just stick to my "grab-bag" method.
Thanks for your time.
Of all the places on Earth, and all the planets in the Universe, I'd rather live here (Perth, W.A.) 
Posts: 241
Threads: 10
Joined: Apr 2022
Reputation:
30
(09-25-2022, 10:53 AM)PhilOfPerth Wrote: @RhoSigma: Laziness had nothing to do with it! I spent a lot of time trying to find the Debug operating details, without success, so I hoped someone with a bit more familiarity with the system would provide them, or at least a path to them.
Oh well!
I have found them now (I found the Wiki itself hard to locate) but am still at a loss as to how to examine my variables states.
I see that I can step through the programme, one line at a time, but nothing in the Wiki instructions tells me how to see the values or changes in variables.
I guess I'll just stick to my "grab-bag" method.
Thanks for your time.
I'll point you back to your other thread, where I explained how to add variables to the watchlist, but obviously you were so in-depth with Pete that you missed it, so here it is: https://staging.qb64phoenix.com/showthre...66#pid6966
And if you think the wiki/repo/discord/latest release is hard to find, it's all here in the forum. Just click the burning "QB64 Phoenix Edition" forum banner at the top of every page to quickly return to the board index, then scroll down to bottom, the last category is named "Official Links" where you find all those links.
Posts: 2,700
Threads: 124
Joined: Apr 2022
Reputation:
134
09-25-2022, 02:05 PM
(This post was last modified: 09-25-2022, 02:11 PM by bplus.)
Oh look what happens when I start a $debug session!
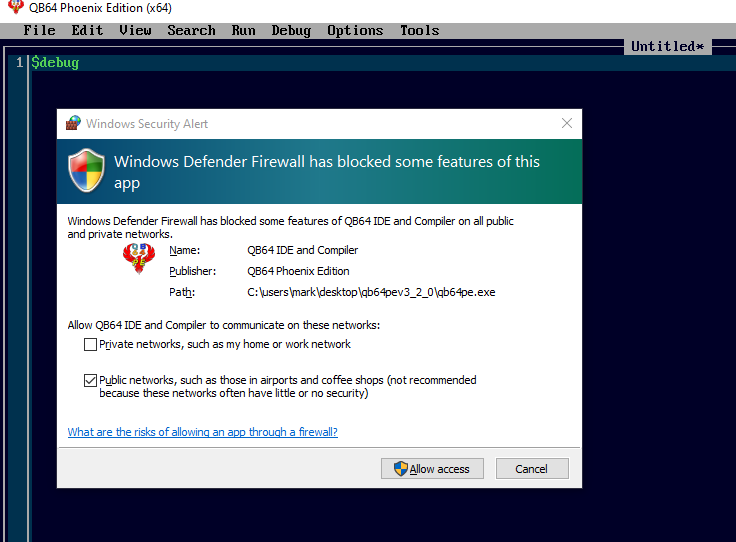
It is curious why the public option (the more dangerous) is the default.
b = b + ...
Posts: 2,700
Threads: 124
Joined: Apr 2022
Reputation:
134
09-25-2022, 02:15 PM
(This post was last modified: 09-25-2022, 02:52 PM by bplus.)
It is also curious, it is only shown the first time I try $debug and I never gave permission to use the public option.
Anyway, after $debug, I typed some code a for loop and asked it to print i^2.
Then I clicked that line # (line #4, that gave it bullet and colored it) to set stop point AKA Breakpoint to watch i, the loop index, and pressed Menu > Debug > Add Watch List...
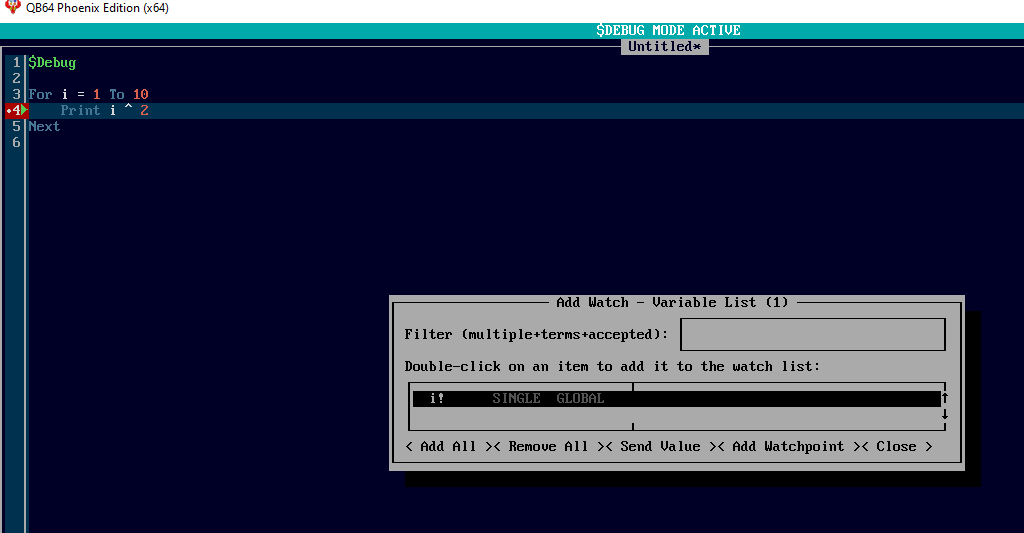
I double clicked i, to add it, now gets + next to it.
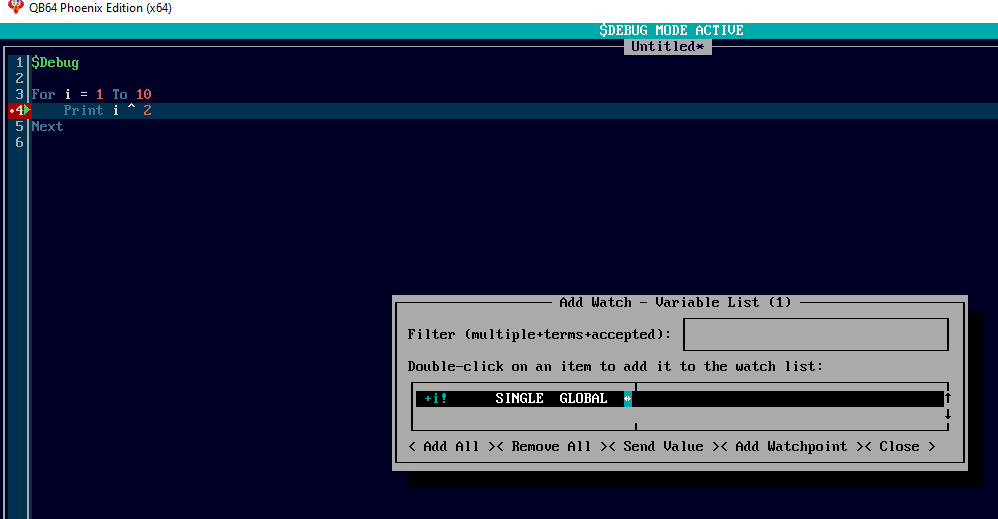
I hit F7 a bunch of times stepping through code, and saw i increase
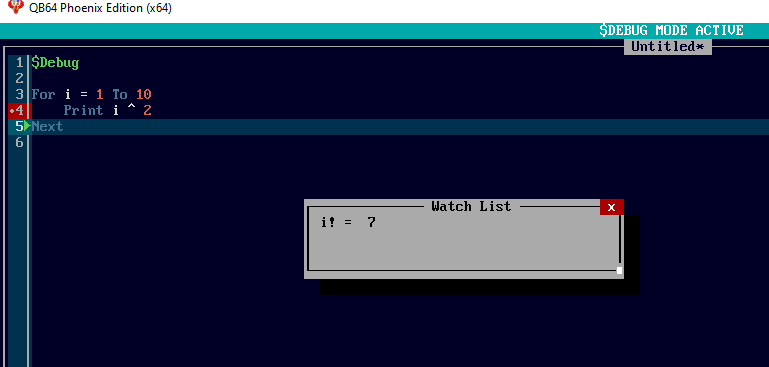
Meanwhile the output screen is buried behind the IDE so I guess you have to minimize IDE and then max again to see output while checking on i as well. (Or maybe the Watch list will stay on top after IDE is minimized.)
So that is my little demo on using $debug for first time. ;-))
b = b + ...
Posts: 714
Threads: 36
Joined: May 2022
Reputation:
13
Quote:Meanwhile the output screen is buried behind the IDE . . .
Good example. I also used the debugger in QB64 for the first time today. Also me was unpleasantly noticeable that the output screen always disappears when the focus is on the IDE. This is impractical!
![[Image: Debug-mit-Watchliste.jpg]](https://i.ibb.co/gT44r1T/Debug-mit-Watchliste.jpg)
Posts: 241
Threads: 10
Joined: Apr 2022
Reputation:
30
(09-25-2022, 02:05 PM)bplus Wrote: Oh look what happens when I start a $debug session!
It is curious why the public option (the more dangerous) is the default.
What's default is not dependent on QB64, but by the system or maybe what kind of network you're currently connected to, no clue TBH. At least I always get the "Privat Network" ticked by default.
Posts: 2,700
Threads: 124
Joined: Apr 2022
Reputation:
134
For 2nd experiment I tried with more variables including an array. Apparently you can spec specific indexes of array which is handy if array is huge!
Code: (Select All) $Debug
ReDim SA$(1 To 10)
j = 5
For i = 1 To 10
j = j + 1
SA$(i) = "J =" + Str$(j)
Print i ^ 2
Next
I double clicked i and array and put 1 to 10 for indexes to watch:
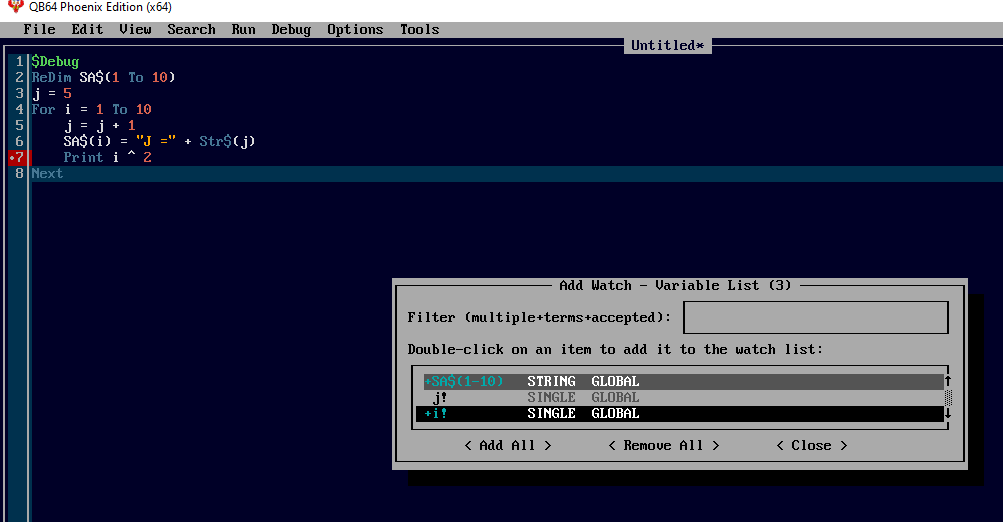
I think I tried F5, just Run and it stopped here:
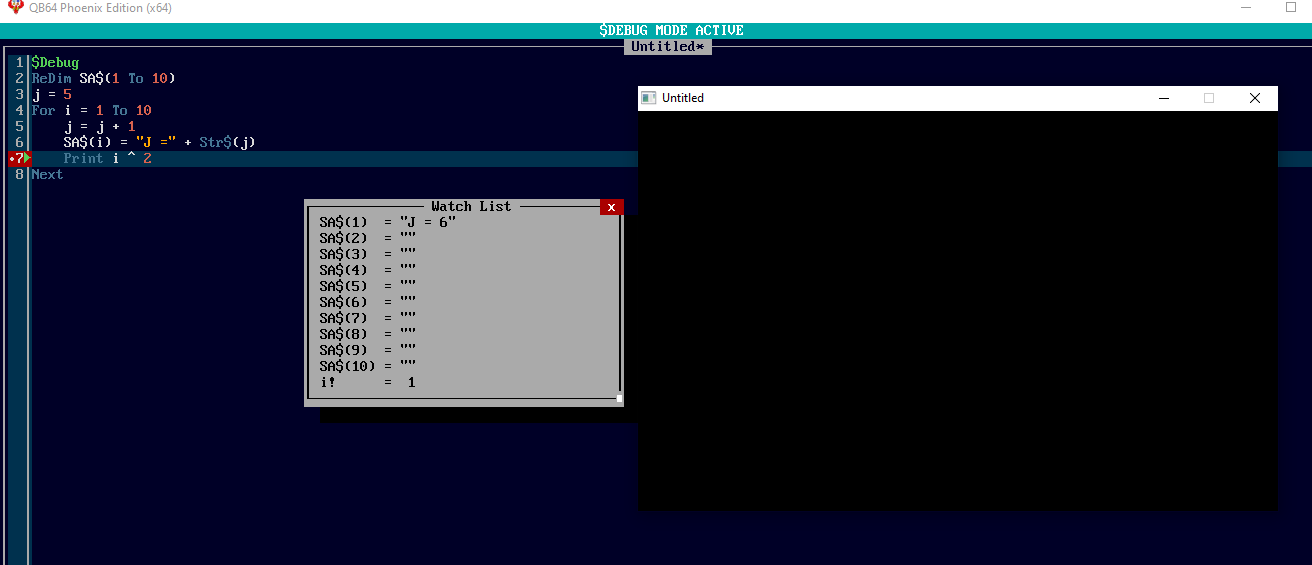
I think I clicked the output exe on task bar to get the output to show with the IDE and watch.
F7 stepping through a few times constantly clicking output and IDE to see output or get focus back to IDE to take another step... The Array is filling out nicely
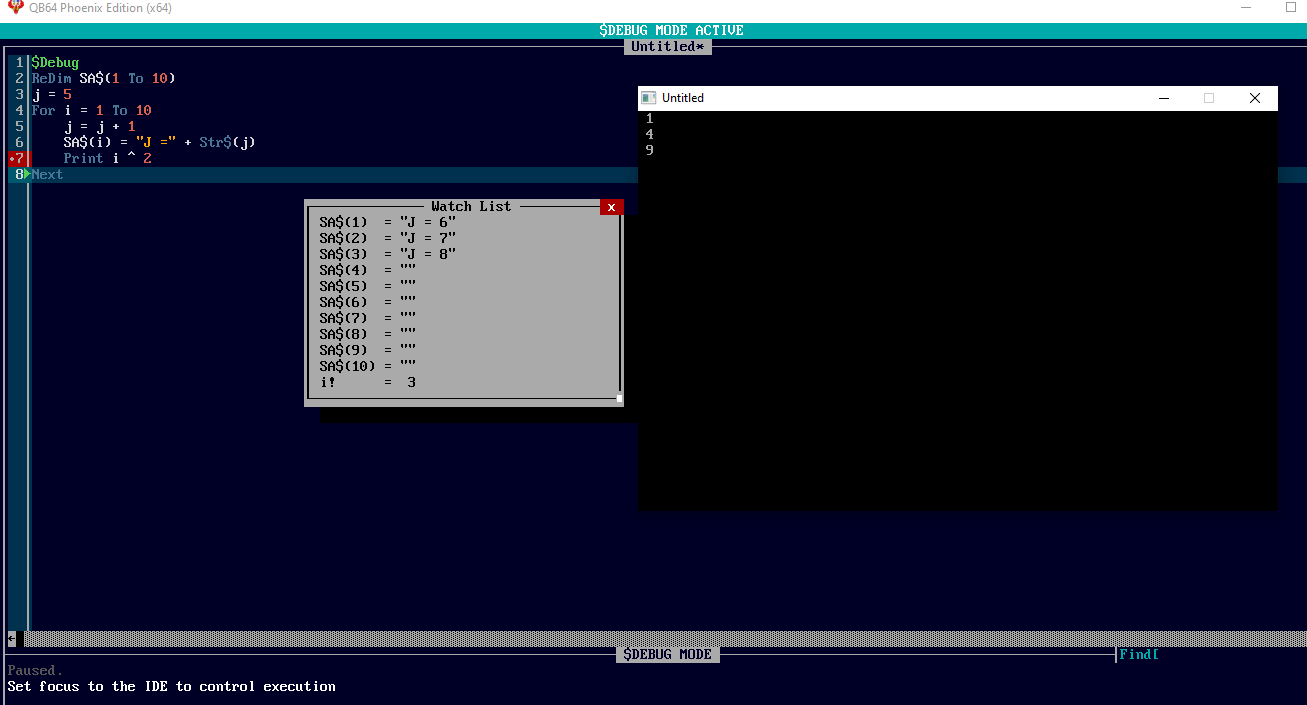
Repeat: You do have to click back and forth from IDE (the IDE PE Icon on Task bar) and output Window (the exe program on Task bar) to see output often to see both things going step by step.
@PhilOfPerth maybe this will give you more clues to using $Debug that must be placed at top of code for Debug Session.
b = b + ...
Posts: 241
Threads: 10
Joined: Apr 2022
Reputation:
30
And for those, who don't need a full fledged debugger, but just need to check for certain conditions here and there, we also have the $ASSERTS metacommand and the respective _ASSERT command.
|
 Any takers?
 Any takers?


![[Image: Debug-mit-Watchliste.jpg]](https://i.ibb.co/gT44r1T/Debug-mit-Watchliste.jpg)